Screenshots
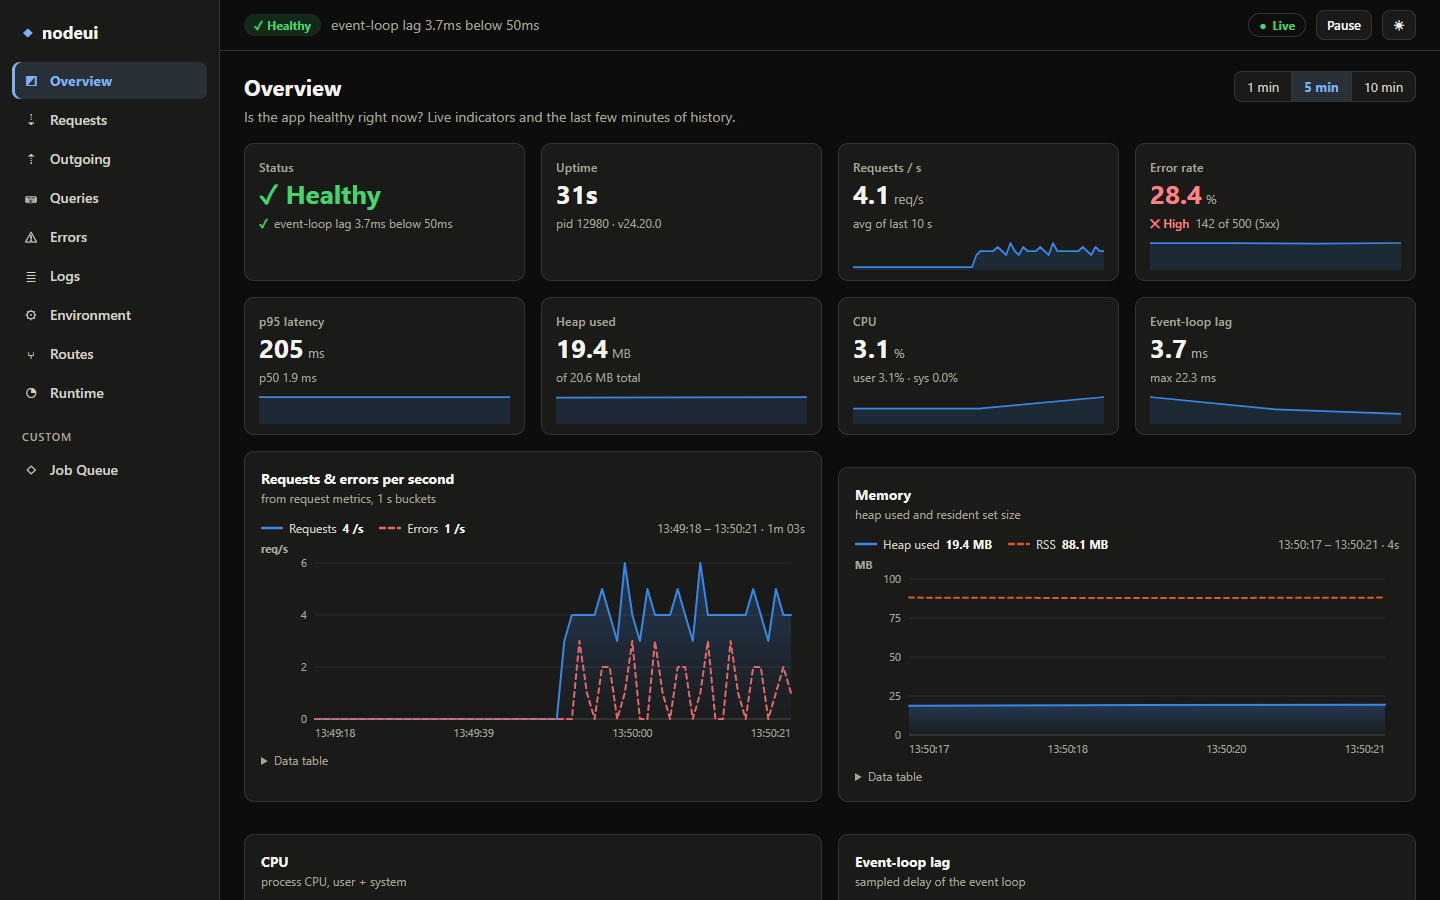
The Express demo (apps/demo-express) running with generated traffic. The Overview answers "is the app healthy right now?" with KPI tiles (status, uptime, req/s, error rate, p95, heap, CPU, event-loop lag), live charts with hover values, status-code breakdown, slowest routes, dependency checks and recent errors.
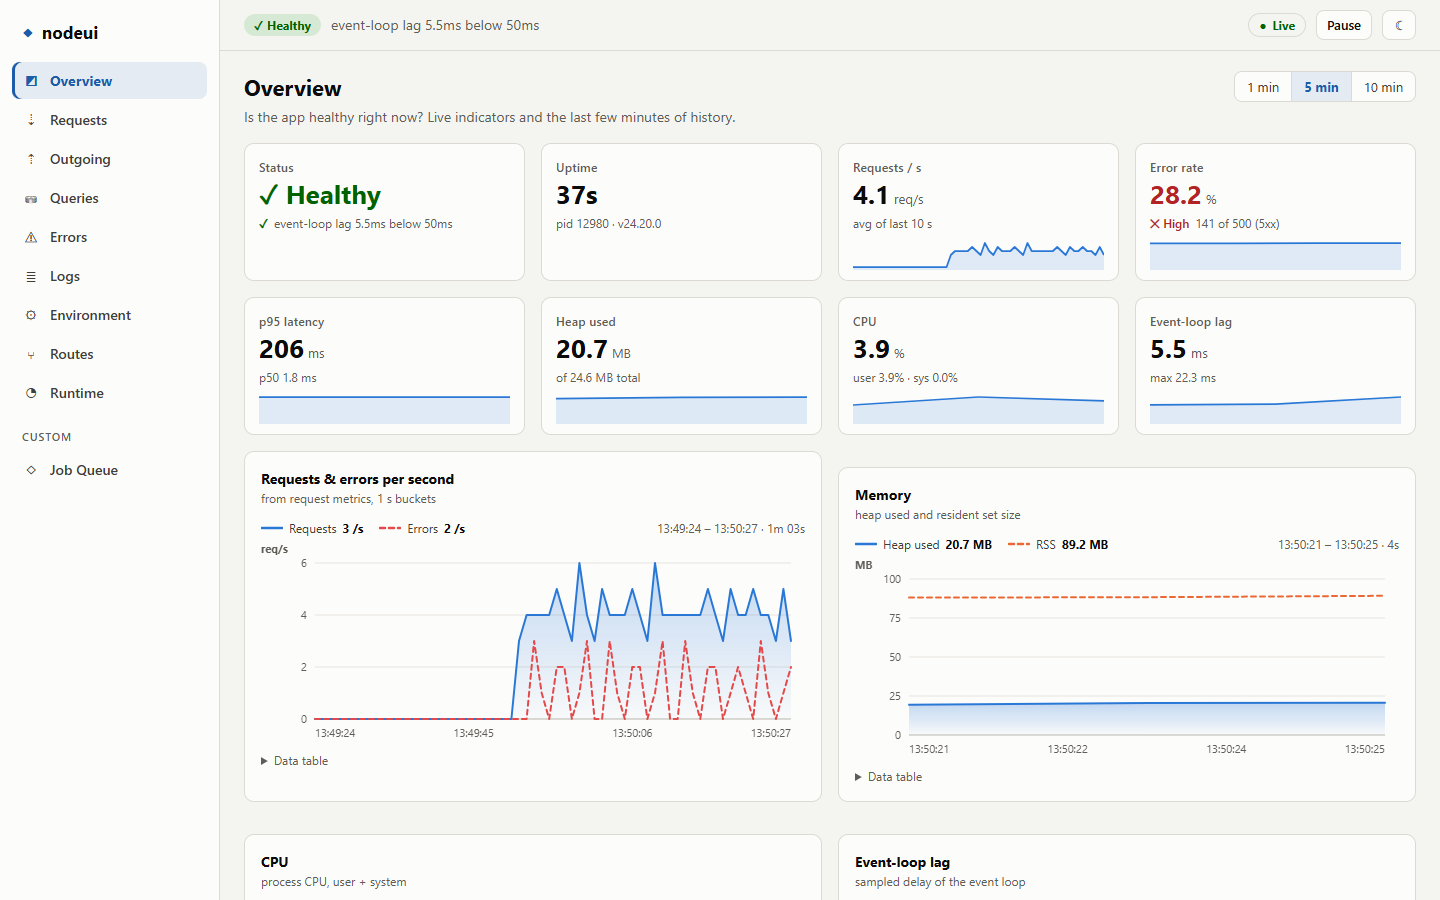
Light theme (follows your OS setting, with a toggle in the header):
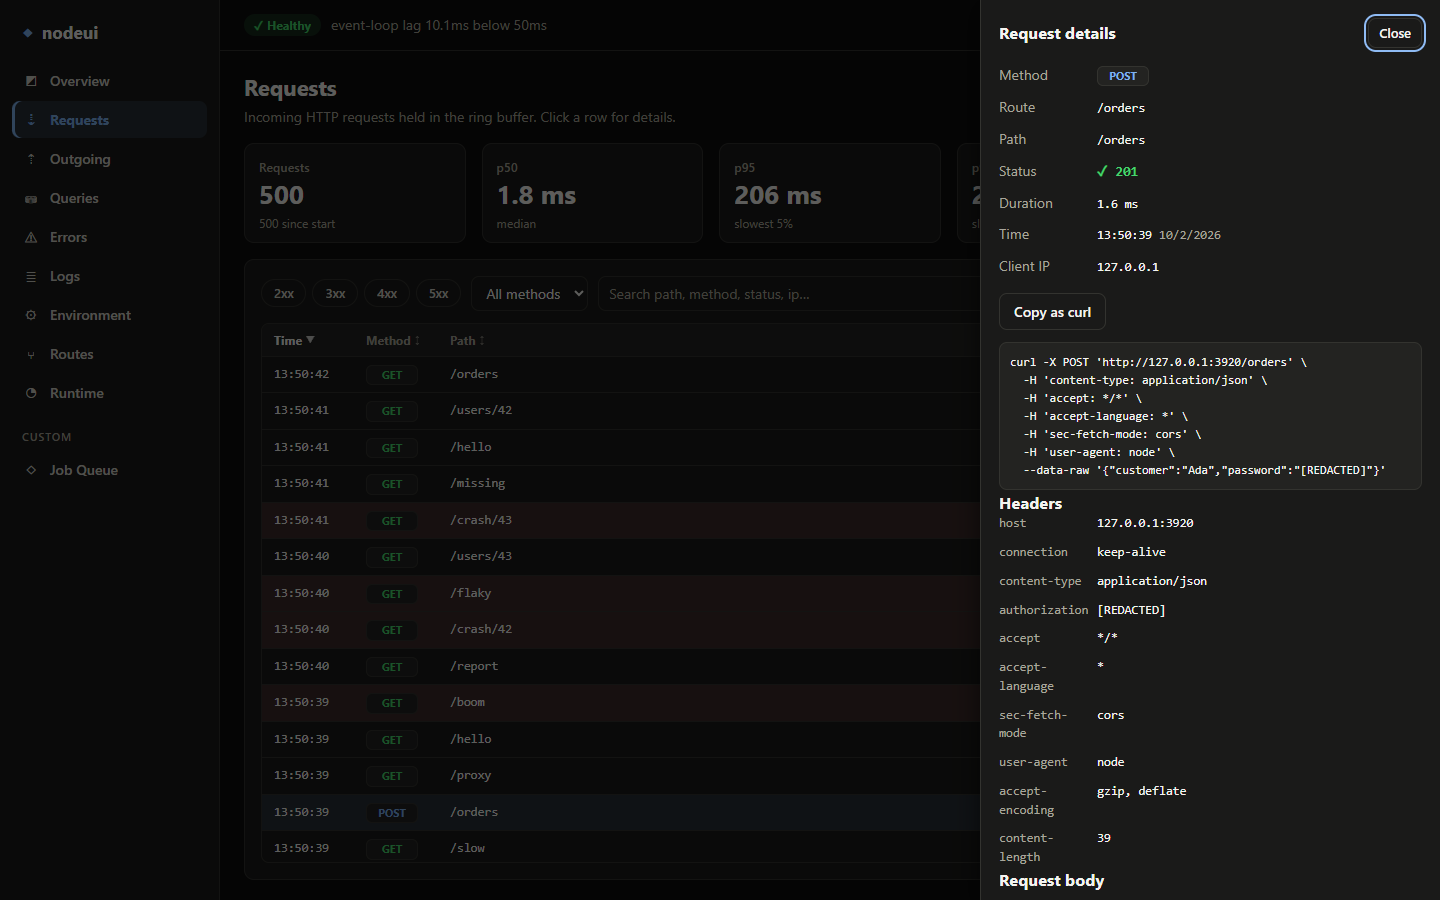
Requests view: p50/p95/p99, error rate, status/method filters, search, sortable columns and a detail drawer with the matched route, headers, captured body and Copy as curl (credentials and secret-looking body fields show as [REDACTED]).
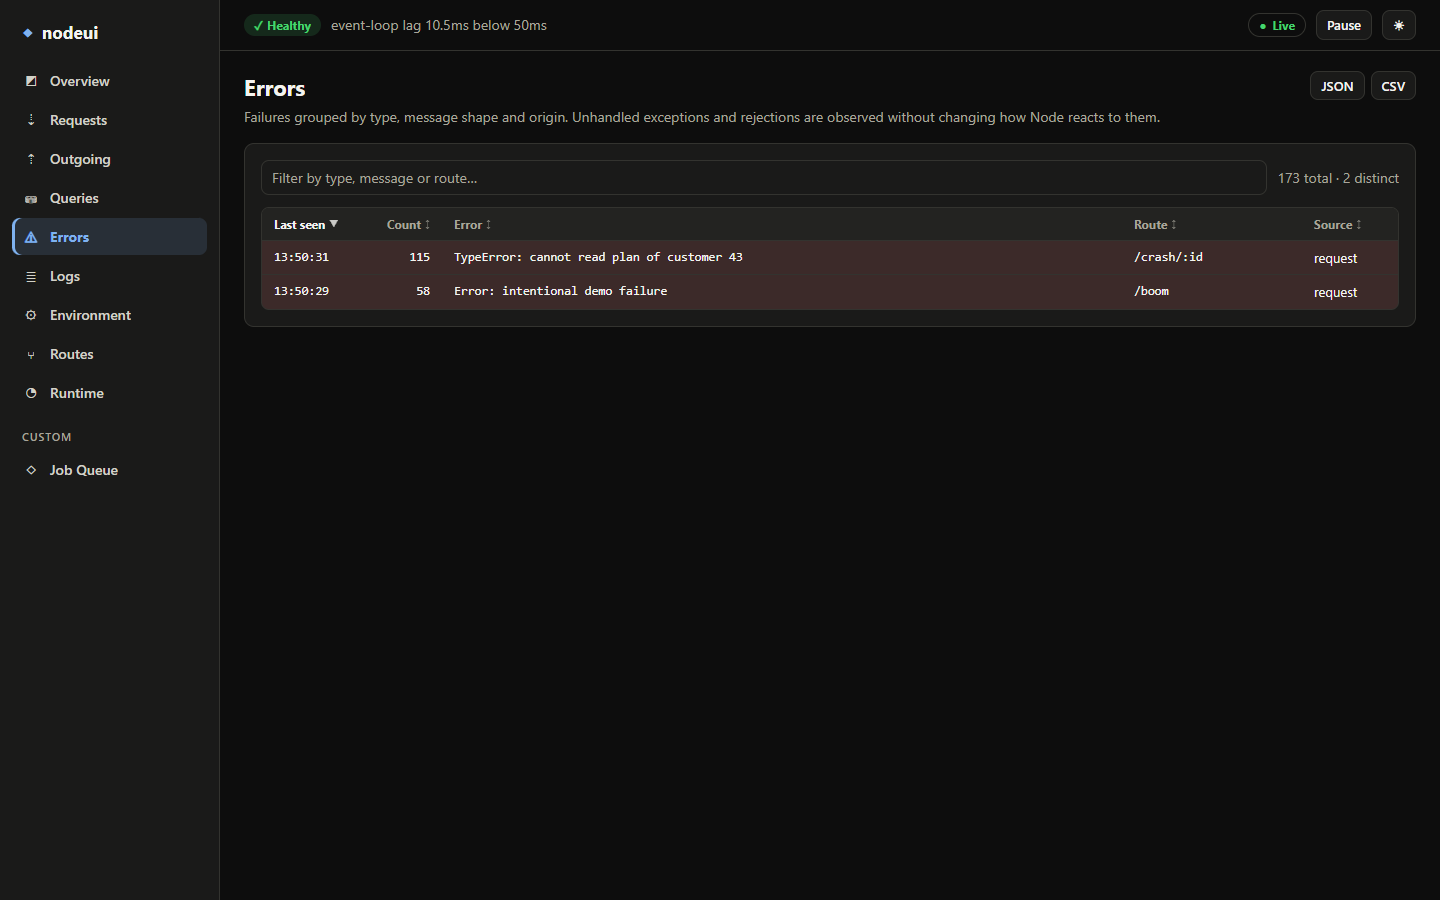
Errors view: failures grouped by type, message shape and origin, with counts, the stack and the linked request.
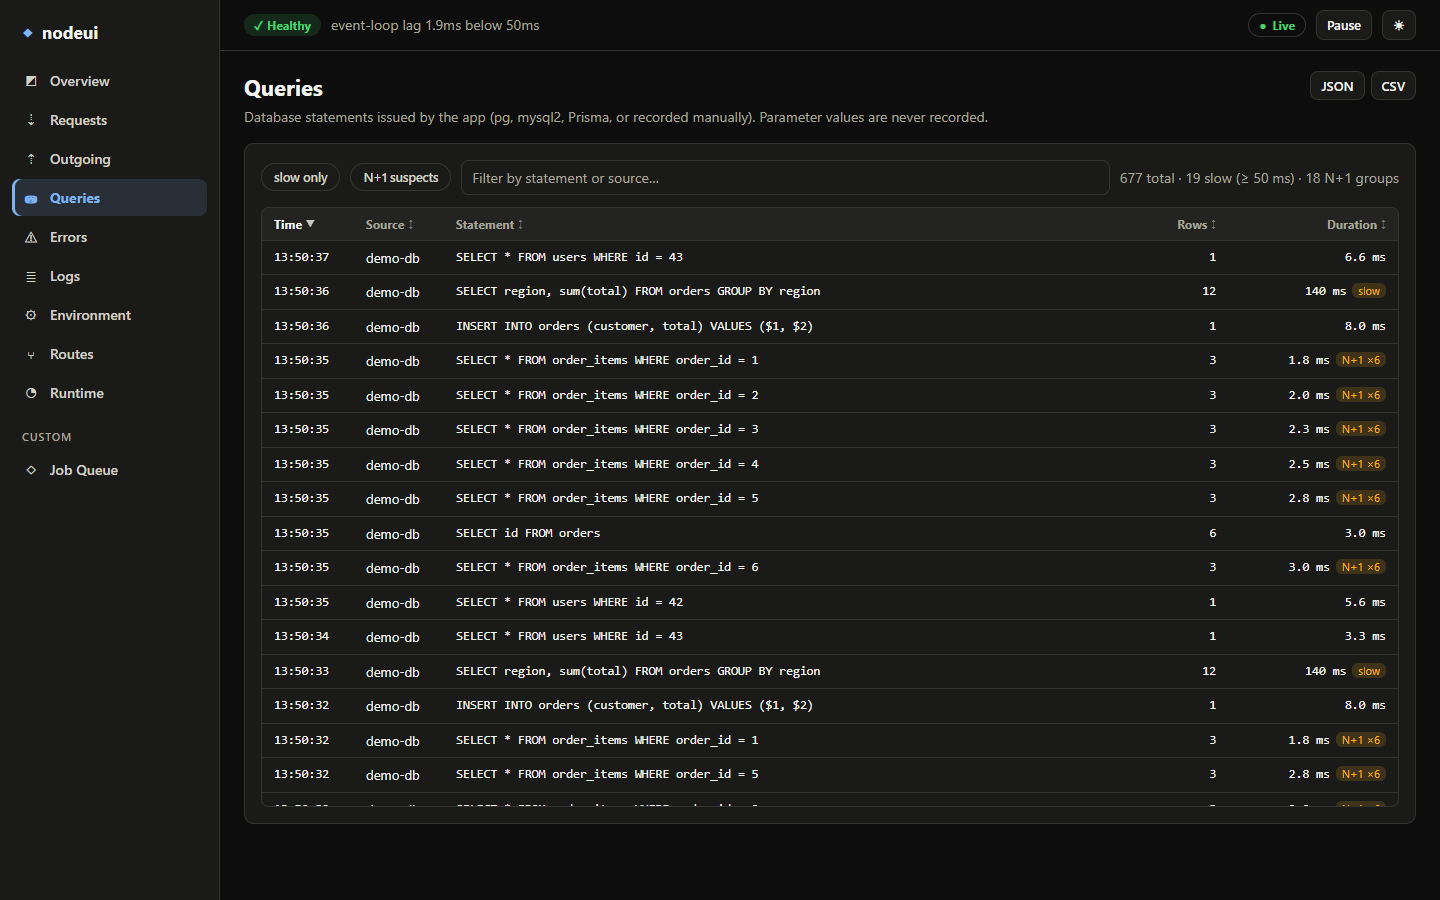
Queries view: SQL statements with duration and rows, flagging slow statements and N+1 suspects (the same statement repeated within one request).
Notice that secrets are masked everywhere: DATABASE_URL, JWT_SECRET and STRIPE_API_KEY show as [REDACTED], and the log line token=abc123 is scrubbed to token=[REDACTED]. Use the sidebar to switch between Overview, Requests, Outgoing, Logs, Environment, Routes, Runtime and your own plugin panels; the Pause button freezes the display so you can read it.